
Faulting and Crustal Mechanics
Second-generation stress mapping
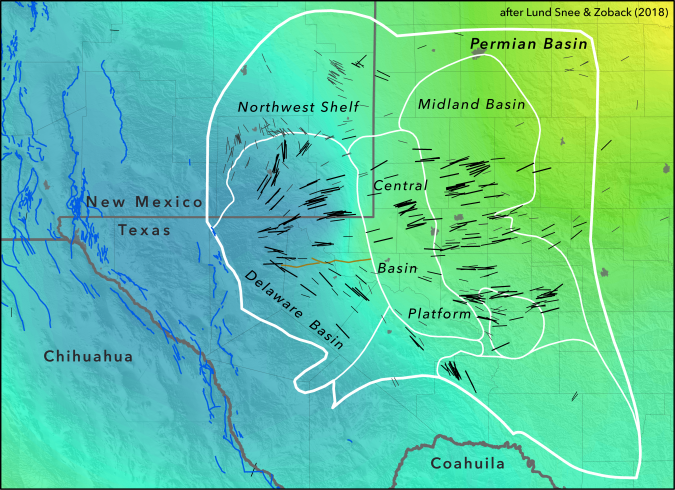
Recently, the Stress and Crustal Mechanics Group has dramatically improved the resolution of stress measurements available across the intraplate parts of the United States. We have added hundreds of orientations of the maximum horizontal principal stress (SHmax), and we have mapped the relative stress magnitudes (faulting regime) across this region for the first time ever. The full map is nearing publication (Lund Snee and Zoback, in prep.), and parts of the results have been reported by:
- Hurd, O. and M.D. Zoback, Intraplate Earthquakes, Regional Stress and Fault Mechanics in the Central and Eastern U.S. and Southeastern Canada, Tectonophysics,581, Dec. 18, 2012, 182-192.
- Lund Snee, Jens-Erik, and Zoback, M.D. 2016. State of stress in Texas: Implications for induced seismicity. Geophysical Research Letters 43, doi:10.1002/2016GL070974.
- Lund Snee, Jens-Erik, and Zoback, M.D. 2018. State of stress in the Permian Basin, Texas and New Mexico: Implications for induced seismicity. The Leading Edge 37(2), 127–134, doi:10.1190/tle37020127.1.
Updated stress measurement quality criteria
We apply standard quality criteria on an A–D scale to determine which stress measurements are reliable. Only reliable measurements (A, B, or C quality) are considered sufficiently reliable to appear on a map. These criteria were first established by Zoback and Zoback (1989) and have since been updated to include additional measurement types, including drilling-induced tensile fractures (DIF), hydraulic fractures defined by aligned groups of microseismic events (HF), and shear-wave velocity anisotropy measured in vertical boreholes (SWA). The updated criteria, from the supplemental files by Lund Snee and Zoback (2018) , are included below for reference.
Quality criteria for SHmax orientations and relative stress magnitudes (φ) obtained from several methods (from Lund Snee and Zoback, 2018)
|
Stress Indicator* |
A |
B |
C |
|---|---|---|---|
|
Drilling-Induced Tensile Fractures (DIF) |
Ten or more distinct tensile fractures in a single well with standard deviation (sd) ≤ 12˚ and with highest and lowest observations at least 300 m apart |
At least six distinct tensile fractures in a single well with sd ≤ 20˚ and with highest and lowest observations at least 100 m apart |
At least four distinct tensile fractures in a single well with sd ≤ 25˚ and with highest and lowest observations at least 30 m apart |
|
Focal Mechanism Inversions (FMF) (Directions) |
Formal inversion of ≥ 35 reasonably well-constrained focal mechanisms resulting in stress directions with sd ≤ 12º |
Formal inversion of ≥ 25 reasonably well-constrained focal mechanisms resulting in stress directions with sd ≤ 20º |
Formal inversion of ≥ 20 reasonably well-constrained focal mechanisms resulting in stress directions with sd ≤ 25º |
|
Focal Mechanism Inversions (FMF) (Relative Magnitude) |
Formal inversion of ≥ 35 reasonably well-constrained focal mechanisms resulting in φ with sd ≤ 0.05 |
Formal inversion of ≥ 25 reasonably well-constrained focal mechanisms resulting in φ with sd ≤ 0.1 |
Formal inversion of ≥ 20 reasonably well-constrained focal mechanisms resulting in φ with sd ≤ 0.2 |
|
Wellbore Breakouts (BO) |
Ten or more distinct breakout zones in a single well (or breakouts in two or more wells in close proximity) with sd ≤ 12˚ and with highest and lowest observations at least 300 m apart |
At least six distinct breakout zones in a single well with sd ≤ 20˚ and with highest and lowest observations at least 100 m apart |
At least four distinct breakout zones in a single well with sd ≤ 25˚ and with highest and lowest observations at least 30 m apart |
|
Microseismic Alignments Along Hydraulic Fractures (HFM) |
Twelve or more distinct linear zones associated with HF stages, with sd ≤ 12˚ |
Eight or more distinct linear zones associated with HF stages, with sd ≤ 20˚ |
Six or more distinct linear zones associated with HF stages, with sd ≤ 25˚ |
|
Shear Velocity Anisotropy from Crossed-Dipole Logs (SWA)† |
Anisotropy ≥ 2% present at a consistent azimuth, with highest and lowest observations at least 300 m apart, and with sd of fast azimuth ≤ 12˚ |
Anisotropy ≥ 2% present at a consistent azimuth, with highest and lowest observations at least 100 m apart, and with sd of fast azimuth ≤ 20˚ |
Anisotropy ≥ 2% present at a consistent azimuth, with highest and lowest observations at least 30 m apart, and with sd of fast azimuth ≤ 25˚ |
*The shallowest measurement must be at least 100 m deep and also sufficiently deep that measurements are not affected by topography.
†In addition to anisotropy ≥ 2%, measurements should ideally have an energy difference between fast and slow shear waves ≥ 50% and a minimum energy ≥ 15%.
Related Publications
- State of stress in areas of induced seismicity across North America. (2020). American Geophysical Union Fall Meeting, paper MR019-0001. https://agu.confex.com/agu/fm20/meetingapp.cgi/Paper/729942
- Direct stress field estimation through waveform matching. (2020). Royal Astronomical Society. https://doi.org/doi:10.1093/gji/ggaa034
- Multiscale variations of the crustal stress field throughout North America. (2020). Nature Group.
- State of stress and seismotectonics in the vicinity of the 9 August 2020 MW5.1 Sparta, North Carolina, earthquake. (2020). Geological Society of America.
- Stress orientation and relative stress magnitudes throughout the North American plate. (2020). Geological Society of America. https://gsa.confex.com/gsa/2020AM/meetingapp.cgi/Paper/353108
- Injection-induced seismicity and fault-slip potential in the Fort Worth Basin, Texas. (2019). https://doi.org/10.1785/0120190017
- State of stress in the Permian Basin, Texas and New Mexico: Implications for induced seismicity. (2018). https://doi.org/10.1190/tle37020127.1
- Scale-invariant stress orientation and seismicity rates near the San Andreas Fault. (2010). https://doi.org/10.1029/2010GL045025
- Zoback, M., Hickman, S., & Ellsworth, W. (2010). Scientific Drilling into the San Andreas Fault - An Overview of SAFOD’s First Five Years. Scientific Drilling, 11, 14-28. https://pangea.stanford.edu/departments/geophysics/dropbox/STRESS/publications/MDZ%20PDF’s/2010/2010_Scientific_drilling_into_San_Andreas_fault.pdf
- Lucier, A., Zoback, M., Heesakkers, V., & Reches, Z. (2008). Constraining the far-field stress state near a deep South African Gold Mine (2008). 42nd US Rock Mechanics Symposium, San Francisco, CA. http://pangea.stanford.edu/departments/geophysics/dropbox/STRESS/publications/MDZ%20PDF’s/2008/Lucier,%20Zoback%20et%20al%20IRMS2008%20in%20press.pdf
- Mallman, E., & Zoback, M. (2007). Assessing elastic Coulomb stress transfer models using seismicity rates in southern California and southwestern Japan. Jour. Geophys. Res., 112. https://doi.org/10.1029/2005JB004076
- Zoback, M., & Zoback, M. (2007). Lithosphere Stress and Deformation, in Earthquake Seismology. Treatise on Geophysics Vol. 6, ed. A. Watts and G. Schubert, Elsevier Ltd., Amsterdam, 253-274. http://pangea.stanford.edu/departments/geophysics/dropbox/STRESS/publications/MDZ%20PDF’s/2007/Zoback%20and%20Zoback%20Final%20Treatise%20Paper.pdf
- Fernandez-Ibanez, F., Soto, J., Zoback, M., & Morales, J. (2007). Present-day stress field in the Gibraltar Arc (Western Mediterranean). Jour. Geophys. Res., 112. https://doi.org/10.1029/2006JB004683
- Boness, N. ., & Zoback, M. (2006). Mapping Stress and Structurally-Controlled Crustal Shear Velocity Anisotropy in California. Geology, 34, 8250828. http://pangea.stanford.edu/departments/geophysics/dropbox/STRESS/publications/MDZ%20PDF’s/2006/boness_zoback_Geology.pdf
- Ito, T., Zoback, M., & Peska, P. (1999). Utilization of mud weights in excess of the least principal stress in extreme drilling environments. In: 37th U.S. Rock Mechanics Symposium, Vail Colorado. http://pangea.stanford.edu/departments/geophysics/dropbox/STRESS/publications/MDZ%20PDF’s/1999/1999-utilization%20of%20mud%20weights.pdf